Shamir, M., Sompolinsky, H. (2004) Nonlinear Population Codes. Neural Computation 16: 1105-1136.
Not exactly what I thought this was about. They are crafting a population code such that they can vary the noise correlations of the neurons, something they argue is biologically relevant. This sets up more information about the stimulus in the higher-order statistics of the firing rates -- i.e. there's more information if you look at the covariances than just at the mean.
So they make a 2-layer FF neural network that has a quadratic non-linearity in the hidden layer. Then they can apparently get the stimulus information much more close to optimal through the network. This quadratic non-linearity is important for conveying the information in the second-order statistics, and some how decorrelates the neural signals. This makes the standard linear readout in the output layer the same as the typically way of reading out population codes.
So maybe worth mentioning something like -- non-linearities in neuron's IO functions could be important for extracting information from the higher-order statistics of neuronal firing (Shamir & Sompolinksy, 2004) or matching the statistics of the input probability distribution (cite needed). I remember some paper, I think we read it in Tanya's course, that discussed the idea that a sigmoid non-linearity is informationally optimal if the input has some Gaussian distribution. The most probable events are in the middle of the Gaussian, which is the steepest part of the sigmoid, and the steeper the output the more information about the input is available.
Friday, April 12, 2013

Thursday, April 11, 2013
Noise and Shunting
Ulrich, 2003; (noise)
Dynamic clamp in L5 pyr somatosensory cortex. Shunting multiplies the voltage, but not the spiking. He adds a GABA blocker and shows that it has an additive effect.
Chance, Abbott, Reyes 2002; (noise)
Dynamic clamp of rat somatosensory cortex slices L5 pyr. Random incoming excitatory and inhibitory synaptic inputs, increasing the "rates" of the inputs causes more shunting and more variance in the injected current. They inject driving current on top of the noisy current, more noise means the gain is decreased. Shunting inhibition without noise leads to shift in the firing-rate curve. They make a model, but its not a simulation -- they have an analytic description of firing rate from noise. The gain effect in the model goes away for high firing rates. Background excitation and inhibition must be balanced.
Mitchell & Silver, 2003; (noise)
Dynamic clamp of cerebellar granule cells. If synaptic excitation is frequency dependent then you get the gain effect, step currents give additive effect. Their IF model gets step shunting inhibition and synaptic excitation, and shows a gain and offset effect. The gain effect requires that the variance of the excitation increases with the level of excitation.
Capaday 2002; (inh feedback or neuromodulators)
Two compartment HH-like conductance model of motorneuron (dendrite and soma). He concludes that the mixture of excitatory and inhibitory conductances do not matter for gain, its not synaptic currents per se, but ligand action on receptors capable of activating intrinsic conductances. Inhibitory feedback can also be used to produce gain (circuit mechanism).
Gabbiani & Knopfel 1994;
Granule cell model -- multi-compartment, but "compact" (which effectively makes it a single compartment, I guess they just have a very low intra-cellular resistance). Shunting inhibition is additive and not multiplicative. This is just Holt & Koch before they described it.
Doiron et al. 2000; (noise)
Complex conductance model of pyramidal cell in electric fish and LIF model. Subthreshold shunting is divisive, in spiking regime additive. They get gain but only if there is stochasticity in the inhibition, and only for low firing rates. The gain is only there if the variance of the inhibition increases with the mean conductance.
Abbott & Chance 2005;
"(It is important to note that, despite comments in the literature to the contrary, divisive inhibition
of neuronal responses cannot arise from so called shunting inhibition. As has been shown both theoretically (Gabbiani et al., 1994; Holt and Koch, 1997) and experimentally (Chance et al., 2002),"
Review based on Chance 2002. They both can suggest that the circuit is doing a driving and balancing act to produce the gain, but require changes in the noise variance.
Salinas & Abbot 1996; (circuit)
Recurrent network for gain control.
Hahnloser et al, 2000; (circuit)
Analog circuit, feedback recurrent excitation and inhibition sets up a gain modulation. Can change the inhibition and alter the gain.
Ayaz & Chance 2009; (noise, circuit)
Normalization pool and modulatory pool, normalization pool driven by the stimuli within RF, modulatory pool driven by stimuli in surround. Inhibtion increases proportionally to the sum of both pools. When the pools increase noisy synaptic input you get a gain effect.
Prescott & De Koninck 2003; (noise, dendritic saturation)
Similar to Chance 2002, need noise but also dendritic saturation apparently helps. Multi-compartmental model of L5 pyramidal cell. Many of the other papers talked about how the gain effect goes away for higher inputs, the saturation prevents that.
Burkitt, Meffin, Graydin 2003; (noise, circuit)
LIF model. Two regimes: linear - excitation and extra leak from background noise cancel out, non-linear - leakiness dominates resulting in diminished gain.
Dynamic clamp in L5 pyr somatosensory cortex. Shunting multiplies the voltage, but not the spiking. He adds a GABA blocker and shows that it has an additive effect.
Chance, Abbott, Reyes 2002; (noise)
Dynamic clamp of rat somatosensory cortex slices L5 pyr. Random incoming excitatory and inhibitory synaptic inputs, increasing the "rates" of the inputs causes more shunting and more variance in the injected current. They inject driving current on top of the noisy current, more noise means the gain is decreased. Shunting inhibition without noise leads to shift in the firing-rate curve. They make a model, but its not a simulation -- they have an analytic description of firing rate from noise. The gain effect in the model goes away for high firing rates. Background excitation and inhibition must be balanced.
Mitchell & Silver, 2003; (noise)
Dynamic clamp of cerebellar granule cells. If synaptic excitation is frequency dependent then you get the gain effect, step currents give additive effect. Their IF model gets step shunting inhibition and synaptic excitation, and shows a gain and offset effect. The gain effect requires that the variance of the excitation increases with the level of excitation.
Capaday 2002; (inh feedback or neuromodulators)
Two compartment HH-like conductance model of motorneuron (dendrite and soma). He concludes that the mixture of excitatory and inhibitory conductances do not matter for gain, its not synaptic currents per se, but ligand action on receptors capable of activating intrinsic conductances. Inhibitory feedback can also be used to produce gain (circuit mechanism).
Gabbiani & Knopfel 1994;
Granule cell model -- multi-compartment, but "compact" (which effectively makes it a single compartment, I guess they just have a very low intra-cellular resistance). Shunting inhibition is additive and not multiplicative. This is just Holt & Koch before they described it.
Doiron et al. 2000; (noise)
Complex conductance model of pyramidal cell in electric fish and LIF model. Subthreshold shunting is divisive, in spiking regime additive. They get gain but only if there is stochasticity in the inhibition, and only for low firing rates. The gain is only there if the variance of the inhibition increases with the mean conductance.
Abbott & Chance 2005;
"(It is important to note that, despite comments in the literature to the contrary, divisive inhibition
of neuronal responses cannot arise from so called shunting inhibition. As has been shown both theoretically (Gabbiani et al., 1994; Holt and Koch, 1997) and experimentally (Chance et al., 2002),"
Review based on Chance 2002. They both can suggest that the circuit is doing a driving and balancing act to produce the gain, but require changes in the noise variance.
Salinas & Abbot 1996; (circuit)
Recurrent network for gain control.
Hahnloser et al, 2000; (circuit)
Analog circuit, feedback recurrent excitation and inhibition sets up a gain modulation. Can change the inhibition and alter the gain.
Ayaz & Chance 2009; (noise, circuit)
Normalization pool and modulatory pool, normalization pool driven by the stimuli within RF, modulatory pool driven by stimuli in surround. Inhibtion increases proportionally to the sum of both pools. When the pools increase noisy synaptic input you get a gain effect.
Prescott & De Koninck 2003; (noise, dendritic saturation)
Similar to Chance 2002, need noise but also dendritic saturation apparently helps. Multi-compartmental model of L5 pyramidal cell. Many of the other papers talked about how the gain effect goes away for higher inputs, the saturation prevents that.
Burkitt, Meffin, Graydin 2003; (noise, circuit)
LIF model. Two regimes: linear - excitation and extra leak from background noise cancel out, non-linear - leakiness dominates resulting in diminished gain.
Wednesday, April 10, 2013
Seeing White: Qualia in the Context of Decoding Population Codes
Lehky, SR. Sejnowski, TJ. (1999) Seeing White: Qualia in the Context of Decoding Population Codes. Neural Computation 11: 1261-1280.
So they argue a very interesting point: in the context of color vision, the typical decoding methods pick out a single value. But when you see white you are seeing the combination of several wavelengths, and the color you experience is separate from the individual wavelengths. Essentially this generalizes to mixtures of stimuli, where typically population codes account for only a single stimulus value. Complex stimuli are represented in a different way than just their average or maximum likelihood estimate, even a multi-modal estimate may not be correct.
White can be thought of as an arbitrary symbol or label marking the presence of a certain combination of color-tuning curve activities. Decoding is not specifying a single physical parameter, but to specifying some region in an abstract psychological space. There is a straight-forward linear transformation from wavelength space (or cone activation space) to 2D CIE color space (which is like HSV). (The mapping actually requires division to compute). Brightness is the 3rd dimension and is represented by absolute levels of activity -- gray and white map to same CIE point, but differ in brightness.

They make a 4 layer NN to get from cones to CIE. Layer 2 is color opponent units "+r-g" which are similar to RGCs. Layer 3 is noncolor opponent and they make a comparison to neurons in V4, this was just the hidden layer of the network.
This, in a way, is just mapping from one population-code space (wavelengths) to another space (CIE color). This is a symbolic representation of a set of variables, which is likely more behaviorally useful (thus is why this system evolved).
So they argue a very interesting point: in the context of color vision, the typical decoding methods pick out a single value. But when you see white you are seeing the combination of several wavelengths, and the color you experience is separate from the individual wavelengths. Essentially this generalizes to mixtures of stimuli, where typically population codes account for only a single stimulus value. Complex stimuli are represented in a different way than just their average or maximum likelihood estimate, even a multi-modal estimate may not be correct.
White can be thought of as an arbitrary symbol or label marking the presence of a certain combination of color-tuning curve activities. Decoding is not specifying a single physical parameter, but to specifying some region in an abstract psychological space. There is a straight-forward linear transformation from wavelength space (or cone activation space) to 2D CIE color space (which is like HSV). (The mapping actually requires division to compute). Brightness is the 3rd dimension and is represented by absolute levels of activity -- gray and white map to same CIE point, but differ in brightness.

They make a 4 layer NN to get from cones to CIE. Layer 2 is color opponent units "+r-g" which are similar to RGCs. Layer 3 is noncolor opponent and they make a comparison to neurons in V4, this was just the hidden layer of the network.
This, in a way, is just mapping from one population-code space (wavelengths) to another space (CIE color). This is a symbolic representation of a set of variables, which is likely more behaviorally useful (thus is why this system evolved).
Arthur Konnerth
Arthur Konnerth is the seminar speaker this week. We had a nice talk at lunch about how electro-physiology was bullshit because of how it interrupts the normal circuit properties of the cell. Stabbing into the cell ruduces the membrane resistance adds a time constant. He was quite challenging no matter which way the conversation went, it was an interesting way of talking about science. At times I felt like I would make a statement agreeing with his point and in return he would come back and question its validity. A prime example was how it would be great to measure the absolute voltages of a cell. I agreed, and then he came back at me questioning the need to. A lot of talk about what it is we are trying to do, and he really challenged me on what I think would come of mapping efforts. We hit upon exploratory vs. hypothesis driven types of Science.
He gave a good talk. It was mainly about the paper where he could measure the individual spine calcium signals and showed that the "inputs" to the dendrites -- calcium in spines, were tuned like "salt and pepper" across the dendrites. Some bias with the neuron's receptive field, but he said he didn't really have enough data to prove so. It was nice he showed that even across different cortical areas there was this salt and pepper to the inputs. (Mainly looking at L2/3 pyramids).
He gave a good talk. It was mainly about the paper where he could measure the individual spine calcium signals and showed that the "inputs" to the dendrites -- calcium in spines, were tuned like "salt and pepper" across the dendrites. Some bias with the neuron's receptive field, but he said he didn't really have enough data to prove so. It was nice he showed that even across different cortical areas there was this salt and pepper to the inputs. (Mainly looking at L2/3 pyramids).
Friday, April 5, 2013
Visualization of image data from cells to organisms
Walter, T. Shattuck, DW. Baldock, R. Bastin, ME. Carpenter, AE. Duce, S. Ellenberg, J. Fraser, A. Hamilton, N. Pieper, S. Ragan, MA. Schneider, JE. Tomancak, P. Heriche, JK. (2010) Visualization of image data from cells to organisms. Nature Methods 7(3)
Lots of data is a problem, need tools to visualize it all, put it all together etc. There are many technical challenges -- file formats, meta-data, etc.
You can use color coding to represent higher-dimensional data, but that only gets you to 5-6 dimensions. Some people have considered converting data to sounds "to take advantage of people's ability to distinguish subtle variations in sounds patterns." (‘data sonification’ (T. Hermann,T. Nattkemper, H. Ritter and W. Schubert. Proc. Mathematical and Engineering Techniques in Medical and Biological Sciences, 745–75))
DTI - several ways of visualizing the tensor directions, gives you 3D data set where each voxel is essentially a 3D value (the colors actualy can work here.)
Registration: simplest form is designate one acquisition as the reference and registering all others to it, but introduces a reference-specific bias. Atlas registration registers to an idealized expert-definied atlas. Something like SIFT might be useful. And here's a paper about gene expression atlases.
I got a bunch of other registration papers, and visualization tool papers from this review to look over.
Lots of data is a problem, need tools to visualize it all, put it all together etc. There are many technical challenges -- file formats, meta-data, etc.
You can use color coding to represent higher-dimensional data, but that only gets you to 5-6 dimensions. Some people have considered converting data to sounds "to take advantage of people's ability to distinguish subtle variations in sounds patterns." (‘data sonification’ (T. Hermann,T. Nattkemper, H. Ritter and W. Schubert. Proc. Mathematical and Engineering Techniques in Medical and Biological Sciences, 745–75))
DTI - several ways of visualizing the tensor directions, gives you 3D data set where each voxel is essentially a 3D value (the colors actualy can work here.)
Registration: simplest form is designate one acquisition as the reference and registering all others to it, but introduces a reference-specific bias. Atlas registration registers to an idealized expert-definied atlas. Something like SIFT might be useful. And here's a paper about gene expression atlases.
I got a bunch of other registration papers, and visualization tool papers from this review to look over.
Cell identification is a sub-problem of vision
The computational challenge of this project is that in many ways identifying cells is a vision/pattern recognition problem. Essentially the visual system is collecting information about the world, creating categorical features from that information, and then using low-level categorizations to make features for the next level up. Its obviously doing a lot more than just these things, but at a basic level this is what powers the visual system.
The most basic features are something like edges/gabor filters. These features can be recreated from algorithms such as ICA, or sparse coding of the visual world. The visual system balances a representation that is complete (or even over-complete) with a representation that is efficient. The representation must be complete (especially at the lower levels), because it isn't like you could be shown something and not see it. Somehow the information is being represented no matter what is being shown, which implies that all information has a representation of some sorts. Efficiency is related to the dimensionality of the representation, and in of itself has important computational properties. An efficient representation transmits only the needed information to understand what is happening. If one could build a model that has a low-dimensional parameter space, then one could only need to transmit the low-dimensional information of those parameters. This would be highly efficient.
What's remarkable is that the visual system is likely able to make these dimensionality trade-offs. When a stimulus that is familiar and has a well-developed low-dimensional parameter space, it is likely only activating a few neurons (but perhaps very strongly). Each of the neurons is acting as a vector in some high-dimensional space, and when only a few need to be activated, then only a low-dimensional subspace is being used for representation. When a strange stimulus, or one that has no low-dimensional description (i.e. white noise), appears then the visual system uses more neurons to represent all the information. It has to since it has to be complete. The learning in the brain is essentially trying to take the high-dimensional representations of unlearned stimuli and find a low-dimensional "model" that also represent the information.
My project is in a way doing a simple vision task. We're skipping some of the stages by developing useful features manually, and then building a good, high-dimensional representation of the properties of the cells. The idea I'm trying to build for the identification of cells is just one stage of the visual algorithm. The challenge is to take the feature space and then start to make classifications on the data. The hierarchy is important, because it allows you to simultaneously represent the data at different levels. An individual cell, say the N cell, as a representation would be at the top. Then perhaps all of the N cells at the next level, then the T and N cells and maybe the AP. Then eventually you get all the way down to just all cells at the bottom. With the hierarchical design, you automatically categorize the individuality of each cell as well as put all of the cells into clusters and describe the build-up of the features. A person is the combination of hands, arms, face, legs, body etc, a face is a combination of a head, eyes, nose, a mouth, an eye is a black circle surrounded by a colored circle surrounded by white. All of these are all together represented simultaneously in the brain. This builds a oneness by a hierarchical representation, which enables the gestalt along with the specific together. I somehow want to capture this in the classification of cells.
What's useful is that the visual system reorganizes its features (or the low-dimensional representation of the categories at each hierarchical level), based on the features that are somehow more informative. And it can alter those features based on how well they classify. I will be starting with some high-dimensional feature space (it won't even really be that high). The first stage will be some sort of dimensionality reduction that creates an efficient feature space -- this will be important because I can plug in similar features that are just slightly different transforms. So I can use absolute positions, position relative to packet, reflected position, which would be a 6-dimensional feature space (3x2 for x and y), but these are not orthogonal dimensions and will be somewhat redundant, but will together in total contain more information than just the individual feature. A low-dimensional projection of this feature space will remove the redundancy of the features and emphasize the useful information from these slightly different representations. So a truly two-dimensional feature (x,y position) is build from an inefficient 6-dimensional representation that relates the information in different ways, which is then reduced to a lower-dimensional space that is more useful for classification. The final space will be more than just two dimensions, but probably only 3 or 4 would be enough to almost fully capture the different information of the position feature.
It would be cool to just use like anatomical features as a starting point to somehow classify all of the cells. Then just from position and size information, you could find some hierarchical clusters that tries to classify the cells from just anatomy. This would take you a long way to classing all of the cells, but probably couldn't fully classify them all. One class would be like the sensory cells in the lateral packets, another would be the small cells around them, another would be the medium cells an the anterior lateral, etc etc. You probably wouldn't have enough information to fully pull out the N cells from the T cells with just anatomy alone, but just this clustering would be very useful. Once we have the functional data, it would be cool to try and cluster without any of the anatomy, and see if cells fall into functional clusters. All of the functional dimensions could also have these high-dimensional, but reduntant representations to keep as much information as possible -- i.e. the swim oscillators can have 2 dimensions representing the swim relative to DP, relative to other oscillators (i.e. 153), etc.
The most basic features are something like edges/gabor filters. These features can be recreated from algorithms such as ICA, or sparse coding of the visual world. The visual system balances a representation that is complete (or even over-complete) with a representation that is efficient. The representation must be complete (especially at the lower levels), because it isn't like you could be shown something and not see it. Somehow the information is being represented no matter what is being shown, which implies that all information has a representation of some sorts. Efficiency is related to the dimensionality of the representation, and in of itself has important computational properties. An efficient representation transmits only the needed information to understand what is happening. If one could build a model that has a low-dimensional parameter space, then one could only need to transmit the low-dimensional information of those parameters. This would be highly efficient.
What's remarkable is that the visual system is likely able to make these dimensionality trade-offs. When a stimulus that is familiar and has a well-developed low-dimensional parameter space, it is likely only activating a few neurons (but perhaps very strongly). Each of the neurons is acting as a vector in some high-dimensional space, and when only a few need to be activated, then only a low-dimensional subspace is being used for representation. When a strange stimulus, or one that has no low-dimensional description (i.e. white noise), appears then the visual system uses more neurons to represent all the information. It has to since it has to be complete. The learning in the brain is essentially trying to take the high-dimensional representations of unlearned stimuli and find a low-dimensional "model" that also represent the information.
My project is in a way doing a simple vision task. We're skipping some of the stages by developing useful features manually, and then building a good, high-dimensional representation of the properties of the cells. The idea I'm trying to build for the identification of cells is just one stage of the visual algorithm. The challenge is to take the feature space and then start to make classifications on the data. The hierarchy is important, because it allows you to simultaneously represent the data at different levels. An individual cell, say the N cell, as a representation would be at the top. Then perhaps all of the N cells at the next level, then the T and N cells and maybe the AP. Then eventually you get all the way down to just all cells at the bottom. With the hierarchical design, you automatically categorize the individuality of each cell as well as put all of the cells into clusters and describe the build-up of the features. A person is the combination of hands, arms, face, legs, body etc, a face is a combination of a head, eyes, nose, a mouth, an eye is a black circle surrounded by a colored circle surrounded by white. All of these are all together represented simultaneously in the brain. This builds a oneness by a hierarchical representation, which enables the gestalt along with the specific together. I somehow want to capture this in the classification of cells.
What's useful is that the visual system reorganizes its features (or the low-dimensional representation of the categories at each hierarchical level), based on the features that are somehow more informative. And it can alter those features based on how well they classify. I will be starting with some high-dimensional feature space (it won't even really be that high). The first stage will be some sort of dimensionality reduction that creates an efficient feature space -- this will be important because I can plug in similar features that are just slightly different transforms. So I can use absolute positions, position relative to packet, reflected position, which would be a 6-dimensional feature space (3x2 for x and y), but these are not orthogonal dimensions and will be somewhat redundant, but will together in total contain more information than just the individual feature. A low-dimensional projection of this feature space will remove the redundancy of the features and emphasize the useful information from these slightly different representations. So a truly two-dimensional feature (x,y position) is build from an inefficient 6-dimensional representation that relates the information in different ways, which is then reduced to a lower-dimensional space that is more useful for classification. The final space will be more than just two dimensions, but probably only 3 or 4 would be enough to almost fully capture the different information of the position feature.
It would be cool to just use like anatomical features as a starting point to somehow classify all of the cells. Then just from position and size information, you could find some hierarchical clusters that tries to classify the cells from just anatomy. This would take you a long way to classing all of the cells, but probably couldn't fully classify them all. One class would be like the sensory cells in the lateral packets, another would be the small cells around them, another would be the medium cells an the anterior lateral, etc etc. You probably wouldn't have enough information to fully pull out the N cells from the T cells with just anatomy alone, but just this clustering would be very useful. Once we have the functional data, it would be cool to try and cluster without any of the anatomy, and see if cells fall into functional clusters. All of the functional dimensions could also have these high-dimensional, but reduntant representations to keep as much information as possible -- i.e. the swim oscillators can have 2 dimensions representing the swim relative to DP, relative to other oscillators (i.e. 153), etc.
Thursday, April 4, 2013
Algorithms for BRAIN -- Human Connectome Project
The BRAIN Initiative was announced this week, and it has been really exciting for people like me already trying to map a nervous system. I've been trying to figure out what to do over the next year to finish my thesis, and the algorithmic side of this project is really the area that needs the most attention. The big challenge will be to create something that not only helps with my thesis project of mapping the neurons in the leech ganglion, but also provides a useful tool for other large-scale brain mapping projects.
The human connectome project comes to mind as a very similar problem from the algorithmic side. This project is at the macro-scale for connectomics -- attempting to map the connectivity of different brain regions using MRI, fMRI, DTI etc. There are several challenges to overcome from the vast amount of data that is being collected, and the algorithms that will help to solve my problems could also be useful in this context. Everyone understands that getting maps of neural activity will be extremely important in understanding how the brain works, but they don't realize that once you have that data, there is a long way to making any sense of it.
Part of the problem with the human connectome project is the problem of registration. Registration is exactly my thesis project -- identification of all of the pieces. In my case I'm trying to identify individual cells across different animals. In the human connectome project, the challenge is to identify individual brain regions. These regions must be consistent and somehow identifiable across individuals. In the fMRI world, typically a brain is mapped on to the "canonical" brain, which is essentially just some ladies brain. The prominent features are analyzed by humans and these features are used to morph individuals onto a single brain-space. The human connectome project is expanding upon this by adding in all the DTI connections, and some fMRI response data to help identify different brain regions.
The feature abstraction that we have started is going to be a useful way of putting these different data sets in the same space so that registration algorithms can work universally. In HCP they get function and anatomical data as well as connectivity data across different brain regions, but like in the leech the same brain region may not be in exactly the same spot etc. But, across animals the same brain regions should have similar functional properties and similar connectivity profiles. By taking all of these as abstract features and then doing registration analysis on this feature space, there may be a consistent tool that can tackle both of these problems and more.
A way of looking at connectomics is based on graphs, which has an extensive mathematical/theoretical background/tools. Graphs are made up of nodes and edges. The connectome is specifying all of the edges -- which nodes are connected. The challenge is to figure out how many nodes there are, and how to match nodes across different individuals/organisms.
The human connectome project comes to mind as a very similar problem from the algorithmic side. This project is at the macro-scale for connectomics -- attempting to map the connectivity of different brain regions using MRI, fMRI, DTI etc. There are several challenges to overcome from the vast amount of data that is being collected, and the algorithms that will help to solve my problems could also be useful in this context. Everyone understands that getting maps of neural activity will be extremely important in understanding how the brain works, but they don't realize that once you have that data, there is a long way to making any sense of it.
Part of the problem with the human connectome project is the problem of registration. Registration is exactly my thesis project -- identification of all of the pieces. In my case I'm trying to identify individual cells across different animals. In the human connectome project, the challenge is to identify individual brain regions. These regions must be consistent and somehow identifiable across individuals. In the fMRI world, typically a brain is mapped on to the "canonical" brain, which is essentially just some ladies brain. The prominent features are analyzed by humans and these features are used to morph individuals onto a single brain-space. The human connectome project is expanding upon this by adding in all the DTI connections, and some fMRI response data to help identify different brain regions.
The feature abstraction that we have started is going to be a useful way of putting these different data sets in the same space so that registration algorithms can work universally. In HCP they get function and anatomical data as well as connectivity data across different brain regions, but like in the leech the same brain region may not be in exactly the same spot etc. But, across animals the same brain regions should have similar functional properties and similar connectivity profiles. By taking all of these as abstract features and then doing registration analysis on this feature space, there may be a consistent tool that can tackle both of these problems and more.
A way of looking at connectomics is based on graphs, which has an extensive mathematical/theoretical background/tools. Graphs are made up of nodes and edges. The connectome is specifying all of the edges -- which nodes are connected. The challenge is to figure out how many nodes there are, and how to match nodes across different individuals/organisms.
Wednesday, April 3, 2013
Transfer Function Review
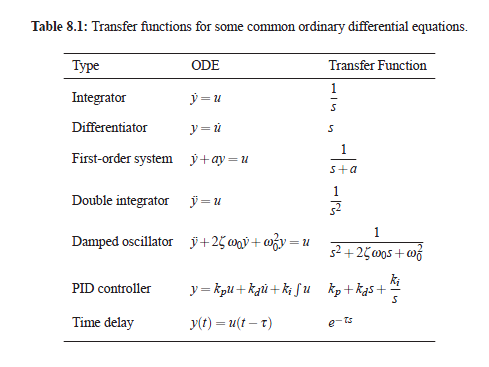
The transfer function of the multiplicative feedback would be really interesting to figure out. Here's Murray's book (he taught the CDS class at Caltech). I was looking through chapter 8 - Transfer Functions to remember how to compute them.
All signals can be represented by a complex exponential - exp(st), s= \sigma + i\omega. Linear systems are represented by two equations, a diff eq and linear eq:
dx/dt = Ax + Bu
y = Cx + Du
where u is the input signal, and y is the output signal. The transfer function is simply the input-output function. For a linear system with where the output is some order derivative (or integral) of the input then the transfer function is just:
G(s) = b(s)/a(s)
Where a(s) and b(s) are polynomials. Poles and zeros are the roots of a(s) and b(s), respectively.
 And then you can do "Block Diagram Algebra" for more complex systems.
 And this can all be further formalized with laplace transforms, but that's basically what he was doing before.
All signals can be represented by a complex exponential - exp(st), s= \sigma + i\omega. Linear systems are represented by two equations, a diff eq and linear eq:
dx/dt = Ax + Bu
y = Cx + Du
where u is the input signal, and y is the output signal. The transfer function is simply the input-output function. For a linear system with where the output is some order derivative (or integral) of the input then the transfer function is just:
G(s) = b(s)/a(s)
Where a(s) and b(s) are polynomials. Poles and zeros are the roots of a(s) and b(s), respectively.


Monday, April 1, 2013
Do we even need to calculate sqrt?
I've been thinking about this some and in terms of a feedback loop it may not be necessary to do the sqrt part. If the interneurons were doing the L2 norm correctly in a feedback loop, then it should always settle to an equilibrium value where the length of the vector is 1. This will be true no matter how large the inputs are, and it should be the only stable state. But if the sqrt is removed, then the normalization should be over-compensated when the vector length is above 1 and under-compensated when the vector length is below 1. This still sends the dynamics to the same stable state, though, it would just probably over/under shoot, but still settle to the correct length.
Without doing the square summation the feedback normalization was not strong enough, I guess, to compensate for the feedback excitation. I think its just that the feedback doesn't grow enough compared to the excitation, so it cannot keep the population normalized to a single value. But if the feedback grows too much, it would just reduce the activity too much and then it would settle to some eq.
...yeah of course not. I'm actually less sure if its even possible regardless if the sqrt would work -- at least from a purely feedback stance. If there's more FF, then there would have to be more inhibition to compensate, but if it always decayed to a stable integral, then the inhibition level would have to be the same. If the inhibition was the same, it couldn't possibly reduce the interneurons enough. So there can't be a feedback circuit that always maintains a normalized vector -- unless you add in feed-forward inhibition too.
It does a pretty good job of keeping it under control in general. I don't have to fiddle with the knobs too much. The feedback has some interesting properties.
Without doing the square summation the feedback normalization was not strong enough, I guess, to compensate for the feedback excitation. I think its just that the feedback doesn't grow enough compared to the excitation, so it cannot keep the population normalized to a single value. But if the feedback grows too much, it would just reduce the activity too much and then it would settle to some eq.
...yeah of course not. I'm actually less sure if its even possible regardless if the sqrt would work -- at least from a purely feedback stance. If there's more FF, then there would have to be more inhibition to compensate, but if it always decayed to a stable integral, then the inhibition level would have to be the same. If the inhibition was the same, it couldn't possibly reduce the interneurons enough. So there can't be a feedback circuit that always maintains a normalized vector -- unless you add in feed-forward inhibition too.
It does a pretty good job of keeping it under control in general. I don't have to fiddle with the knobs too much. The feedback has some interesting properties.
Sunday, March 31, 2013
Differential signaling via the same axon of neocortical pyramidal neurons
Markram, H. Wang, Y. Tsodyks, M. (1998) Differential signaling via the same axon of neocortical pyramidal neurons. PNAS 95: 5323-5328.
Somatosensory slice in rats, whole cell triple recordings. They model facilitation with the paramter u, which increases by U * (1-u) for each pre-spike and decays to U for its equilibrium. This gives them that facilitation, but its only truly facilitation over some regime.
L5 tufted Py to py depressed with different values. Same pyramidal neuron could show depression onto another Py and facilitation onto a bipolar cell.
Different pyramidal cells show slightly different types of facilitation onto the same interneuron:
 He talks about a super-linear, linear, and sub-linear regime for the dynamics, which I think is a consequence of his model the data somewhat show that too.
So, yeah, in his model u goes through this sigmoidal shape depending on the pre-synaptic firing rate. This causes different levels of current build-up - that's his super-lin-sub (SLS). In SLS he just means the efficacy of each psp, not the total integral. His model looks quadratic over some regime, depending on all the parameters.
Somatosensory slice in rats, whole cell triple recordings. They model facilitation with the paramter u, which increases by U * (1-u) for each pre-spike and decays to U for its equilibrium. This gives them that facilitation, but its only truly facilitation over some regime.
L5 tufted Py to py depressed with different values. Same pyramidal neuron could show depression onto another Py and facilitation onto a bipolar cell.
Different pyramidal cells show slightly different types of facilitation onto the same interneuron:

So, yeah, in his model u goes through this sigmoidal shape depending on the pre-synaptic firing rate. This causes different levels of current build-up - that's his super-lin-sub (SLS). In SLS he just means the efficacy of each psp, not the total integral. His model looks quadratic over some regime, depending on all the parameters.
Friday, March 29, 2013
The temporal side of the rate model
So the spiking model derived in the gain paper is basically now completely capabable of implementing the rate models, but there is now a new dimension. There are all of the time constants that can be altered without changing the relationship between rate models and spiking models -- there is always some counter balance to the time constant, decreasing the tau could be compensated by increasing w.
So that opens up a lot of possibilities about how the time constants relate to all types of neuronal phenomenon and what that could mean in terms of what a rate model even would mean in spiking neurons. Adaptation is a nice illustration of something that would on the surface seems as a variability that would break the rate model, but actually it can stay consistent within the rate model terms. I(t) is a temporal variable, and our model was just the most simple equilibrium direct model -- there are a bunch of ways to maintain the linearity. The spiking-current relationship can stay linear while varying through time. The translation of current to spike is essentially as if you are running a filter through a temporal signal, this is actually just a linear transformation. Its kinda like the complex plane -- the Rate model is like the real valued numbers, but that is just a single line among an infinitely large set of other lines and that is the spiking model.
short-term plasticity: i have this idea about how to implement normalization with STP, i've gone pretty far on it already. its coming.
long-term plasticity: at this scale we have to ask what exactly are we trying to learn? This is a level above the general population-code, and onto the specifics about what exactly are the things the population code are representing or learning? The P-cells are just one of a small set of sensory neurons that all form synapses with some population of interneurons that likely greatly overlaps. The entire sensory environment seems to be projected as a vector in a high dimensional space onto these interneurons (like in the leech), which represent all the information is a population code. A particular sensory dimension does not point down a particular neurons axis, but the linear combination of multiple neurons. In an almost (or perhaps in a warped subspace or something?) orthogonal direction are vectors that represent the other dimensions of the sensory world. The various weights of the projection tuned to send the population in one direction in a high dimensional space. LTP sets up all of these weights and communication between neurons wires the circuit up to form these population representations. What do simple rules like STDP mean in these spiking models? How do the neurons differentiate themselves to form a full basis of the information?
neuromodulators: at an intermediate scale neuromodulators may play a role in maintaining the long-term and slower kinetics of the nervous system (all while maintaining the rate model). It is really interesting how many CPGs are modulated by neuromodulators, perhaps there is a high-dimensional neuro-modulator space that can activate many different types of CPGs. The CPGs likely use the neuromodulators as a positive feedback loop to maintain the patterns over larger, but also adjustable time-scales. If dopamine activates swimming, then there is likely a dopamine signal that could get regulated to adjust the length of the swim. I think the CPGs are wired up in feed-back circuits and perhaps have intrinsically rhythmic properties to generate the temporal patterns of the rhythms (i guess transmitter kinetics is definitely another time-scale). But these longer 10s to 100s of seconds time scales seem to be controlled by positive feedback-loops with neuro-modulators. These could have their own slower kinetics that drive seconds-level changes in behavioral transitions, and can obviously be modulated. The neuromodulators are just altering the population code and the transformation of the sensory world into behavioral output. If the sensory cells activated the interneuron population code to point in the direction that means "you just got shocked! start swimming!", then the synapses from the interneurons to the CPG/motor neurons would activate the swim CPG. With no feedback the sensory shock could set up a positive dopamine feedback loop that could take seconds to decay -- the sensory population code can settle back to its current sensory environment (since it is no longer being shocked, it will no longer be in the shock basin), and the pattern generator can just continue. The sensory environment can shut down the pattern generator if it wants, or leave it on if it needs by maintaining the neuromodulation -- and by direct shutdown of the motor neurons if it needs to end the pattern faster.
So the interganglionic connections would likely be sensory pop-code to sensory pop-code, and CPG/motor to CPG/motor, mainly. Perhaps sensory-pop to CPG, but less CPG to sensory-pop. It would seem like if there were feedback connections from CPG to sensory-pop then that would just be for like a reference signal, perhaps a predictive signal that could even modulate the sensory-pop, but likely would not drive it. It would be a nice signal to have to adjust the sensory feedback and close the loop.
So that opens up a lot of possibilities about how the time constants relate to all types of neuronal phenomenon and what that could mean in terms of what a rate model even would mean in spiking neurons. Adaptation is a nice illustration of something that would on the surface seems as a variability that would break the rate model, but actually it can stay consistent within the rate model terms. I(t) is a temporal variable, and our model was just the most simple equilibrium direct model -- there are a bunch of ways to maintain the linearity. The spiking-current relationship can stay linear while varying through time. The translation of current to spike is essentially as if you are running a filter through a temporal signal, this is actually just a linear transformation. Its kinda like the complex plane -- the Rate model is like the real valued numbers, but that is just a single line among an infinitely large set of other lines and that is the spiking model.
short-term plasticity: i have this idea about how to implement normalization with STP, i've gone pretty far on it already. its coming.
long-term plasticity: at this scale we have to ask what exactly are we trying to learn? This is a level above the general population-code, and onto the specifics about what exactly are the things the population code are representing or learning? The P-cells are just one of a small set of sensory neurons that all form synapses with some population of interneurons that likely greatly overlaps. The entire sensory environment seems to be projected as a vector in a high dimensional space onto these interneurons (like in the leech), which represent all the information is a population code. A particular sensory dimension does not point down a particular neurons axis, but the linear combination of multiple neurons. In an almost (or perhaps in a warped subspace or something?) orthogonal direction are vectors that represent the other dimensions of the sensory world. The various weights of the projection tuned to send the population in one direction in a high dimensional space. LTP sets up all of these weights and communication between neurons wires the circuit up to form these population representations. What do simple rules like STDP mean in these spiking models? How do the neurons differentiate themselves to form a full basis of the information?
neuromodulators: at an intermediate scale neuromodulators may play a role in maintaining the long-term and slower kinetics of the nervous system (all while maintaining the rate model). It is really interesting how many CPGs are modulated by neuromodulators, perhaps there is a high-dimensional neuro-modulator space that can activate many different types of CPGs. The CPGs likely use the neuromodulators as a positive feedback loop to maintain the patterns over larger, but also adjustable time-scales. If dopamine activates swimming, then there is likely a dopamine signal that could get regulated to adjust the length of the swim. I think the CPGs are wired up in feed-back circuits and perhaps have intrinsically rhythmic properties to generate the temporal patterns of the rhythms (i guess transmitter kinetics is definitely another time-scale). But these longer 10s to 100s of seconds time scales seem to be controlled by positive feedback-loops with neuro-modulators. These could have their own slower kinetics that drive seconds-level changes in behavioral transitions, and can obviously be modulated. The neuromodulators are just altering the population code and the transformation of the sensory world into behavioral output. If the sensory cells activated the interneuron population code to point in the direction that means "you just got shocked! start swimming!", then the synapses from the interneurons to the CPG/motor neurons would activate the swim CPG. With no feedback the sensory shock could set up a positive dopamine feedback loop that could take seconds to decay -- the sensory population code can settle back to its current sensory environment (since it is no longer being shocked, it will no longer be in the shock basin), and the pattern generator can just continue. The sensory environment can shut down the pattern generator if it wants, or leave it on if it needs by maintaining the neuromodulation -- and by direct shutdown of the motor neurons if it needs to end the pattern faster.
So the interganglionic connections would likely be sensory pop-code to sensory pop-code, and CPG/motor to CPG/motor, mainly. Perhaps sensory-pop to CPG, but less CPG to sensory-pop. It would seem like if there were feedback connections from CPG to sensory-pop then that would just be for like a reference signal, perhaps a predictive signal that could even modulate the sensory-pop, but likely would not drive it. It would be a nice signal to have to adjust the sensory feedback and close the loop.
Wednesday, March 27, 2013
Monday, March 18, 2013
Thursday, March 14, 2013
Newsome and free will
Bill Newsome gave a talk today about his ideas of free will, and I thought they were quite good. The overall premise was that he doesn't quite like the notion of bottom-up determinism as the end-all to free will -- he didn't say that bottom-up determinism was incorrect, but that the problem doesn't just end at bottom-up determinism and that there is more to it.
In the end, his rationale was based on emergence. Free will only exists above a certain level of a physical causal hierarchy. Quantum mechanics is at the bottom, and ultimately all phenomenon are derived from the laws of quatum mechanics, but there are important laws that come out at each level. These laws have important information and cannot be seen through a lens that just focuses on the pieces. The organization of the pieces as well as the rules of the pieces come together to create the rules at a higher level. The organization has information that shapes the rules, and thus without the information about the organization the pieces truly do not sum to the whole. Each higher level is defined by the pieces from a lower level, each piece follows its own set of rules. Only when the pieces are organized correctly do they produce rules at the higher level. A lion can kill me, the pieces of the lion cannot, unless they are organized into a lion.
So the true definition of free will shouldn't be looked at as something that arises from the laws of physics -- there is a certain level in the hierarchy below which free will become meaningless. Free will exists at a higher level. To have free will one must have beliefs and thoughts and aspirations, and then be able to act on those things. These are rules at a higher level of the hierarchy, and yes these things are still fully determined by the laws that govern the lowest level, but a meaningful definition of free will can come out from this distinction of different levels of causality. This gives some form of free will from a legal/moral sense, although it is still hard to draw a solid line.
Causality and complexity then arise from a hierarchical structure in dynamical systems. At the lowest level, lets just say its atoms, there are a few equations that govern all of the atoms. These are essentially differential equations, and thus for each atom there is a state-space that is determined by the differential equations and the initial conditions. The initial conditions in a way describe the information about the organization of all the pieces. All the atoms in the Universe form a vast high-dimensional dynamical system which ultimately produces everything else. However, there are lower-dimensional sub-structures which share properties -- i.e. the full system's dimensionality can be reduced in a way that describes a sub-system that behaves as if it has its own set of rules.
So the higher levels share a commonality because they have a lower dimensional projections from the higher dimensional space of the level below, that essentially looks the same. In the high dimensional space they are always separated, but there is a low-dimensional projections where the same rules come out that govern the system. The software of a computer is information about a particular program. At the low level copying software from one computer to another is fundamentally different -- there are different transistors that are processing the information. So all of the transistors in the world make up the full transistor space, but their dynamics can be projected on to a common lower-dimensional subspace that looks the same. The information of the software determines the system, and the low dimensional projection has meaningful rules.
In the end, his rationale was based on emergence. Free will only exists above a certain level of a physical causal hierarchy. Quantum mechanics is at the bottom, and ultimately all phenomenon are derived from the laws of quatum mechanics, but there are important laws that come out at each level. These laws have important information and cannot be seen through a lens that just focuses on the pieces. The organization of the pieces as well as the rules of the pieces come together to create the rules at a higher level. The organization has information that shapes the rules, and thus without the information about the organization the pieces truly do not sum to the whole. Each higher level is defined by the pieces from a lower level, each piece follows its own set of rules. Only when the pieces are organized correctly do they produce rules at the higher level. A lion can kill me, the pieces of the lion cannot, unless they are organized into a lion.
So the true definition of free will shouldn't be looked at as something that arises from the laws of physics -- there is a certain level in the hierarchy below which free will become meaningless. Free will exists at a higher level. To have free will one must have beliefs and thoughts and aspirations, and then be able to act on those things. These are rules at a higher level of the hierarchy, and yes these things are still fully determined by the laws that govern the lowest level, but a meaningful definition of free will can come out from this distinction of different levels of causality. This gives some form of free will from a legal/moral sense, although it is still hard to draw a solid line.
Causality and complexity then arise from a hierarchical structure in dynamical systems. At the lowest level, lets just say its atoms, there are a few equations that govern all of the atoms. These are essentially differential equations, and thus for each atom there is a state-space that is determined by the differential equations and the initial conditions. The initial conditions in a way describe the information about the organization of all the pieces. All the atoms in the Universe form a vast high-dimensional dynamical system which ultimately produces everything else. However, there are lower-dimensional sub-structures which share properties -- i.e. the full system's dimensionality can be reduced in a way that describes a sub-system that behaves as if it has its own set of rules.
So the higher levels share a commonality because they have a lower dimensional projections from the higher dimensional space of the level below, that essentially looks the same. In the high dimensional space they are always separated, but there is a low-dimensional projections where the same rules come out that govern the system. The software of a computer is information about a particular program. At the low level copying software from one computer to another is fundamentally different -- there are different transistors that are processing the information. So all of the transistors in the world make up the full transistor space, but their dynamics can be projected on to a common lower-dimensional subspace that looks the same. The information of the software determines the system, and the low dimensional projection has meaningful rules.
Friday, February 8, 2013
Population coding under normalization
Ringach, DL. (2010) Population coding under normalization. Vision Research 50: 2223-2232.
"Normalization is a widespread computation in the brain; it can be found in the retina (Benardete, Kaplan, & Knight, 1992; Shapley & Victor, 1979a, 1979b, 1981; Solomon, Lee, & Sun, 2006), the lateral geniculate nucleus (Bonin, Mante, & Carandini, 2005, 2006), primary visual cortex (Carandini et al., 1997; Heeger, 1992; Ringach & Malone, 2007; Rust, Schwartz, Movshon, & Simoncelli, 2005), area MT (Simoncelli & Heeger, 1998), and area IT (Zoccolan, Cox, & DiCarlo, 2005). Furthermore, normalization models appear to account well for the modulatory effects of attention (Reynolds, Chelazzi, & Desimone, 1999; Reynolds & Heeger, 2009)."
"These findings demonstrate that normalization imposes important constraints on the coding of information and, giving its incidence in cortical circuits, it should be incorporated as an integral
component in formal models of population coding."
Normalization model of simple cells in V1: Carandini et al. 1997, Heeger, 1992.

normalization in orientation tuning: Benyishai, Baror & Sompolinsky, 1995; Salinas & Abbott, 1994; Seung & Sompolinsky, 1993).
Only a small number of neurons is needed to efficiently encode an orientation.
They then relate the problem of normalized population coding with fitting a necklace on a hypersphere, having each node of necklace spaced out as far as possible. This is like a maximum entropy arrangement, leading to most information.
Not always beneficial to sharpen tuning curves (information in population code): Zhang & Sejnowski, 1999.
Normalization and correlated noise: Abbott & Dayan, 1999; Averback, Latham & Pouget, 2006; Sompolinsky et al. 2001.
their geometrical approach as related to the probabilistic view of encoding: Beck, Ma, Latham & Pouget, 2007; Beck et al., 2008; Pouget, Dayan & Zemel, 2000, 2003; Schwartz & Simoncelli, 2001; Simoncelli & Olshausen, 2001; Zemel, Dayan, & Pouget, 1998.
Spiking neurons: Jazayeri & Movshon, 2006; Ma, Beck, Latham, & Pouget, 2006.
"Normalization is a widespread computation in the brain; it can be found in the retina (Benardete, Kaplan, & Knight, 1992; Shapley & Victor, 1979a, 1979b, 1981; Solomon, Lee, & Sun, 2006), the lateral geniculate nucleus (Bonin, Mante, & Carandini, 2005, 2006), primary visual cortex (Carandini et al., 1997; Heeger, 1992; Ringach & Malone, 2007; Rust, Schwartz, Movshon, & Simoncelli, 2005), area MT (Simoncelli & Heeger, 1998), and area IT (Zoccolan, Cox, & DiCarlo, 2005). Furthermore, normalization models appear to account well for the modulatory effects of attention (Reynolds, Chelazzi, & Desimone, 1999; Reynolds & Heeger, 2009)."
"These findings demonstrate that normalization imposes important constraints on the coding of information and, giving its incidence in cortical circuits, it should be incorporated as an integral
component in formal models of population coding."
Normalization model of simple cells in V1: Carandini et al. 1997, Heeger, 1992.

normalization in orientation tuning: Benyishai, Baror & Sompolinsky, 1995; Salinas & Abbott, 1994; Seung & Sompolinsky, 1993).
Only a small number of neurons is needed to efficiently encode an orientation.
They then relate the problem of normalized population coding with fitting a necklace on a hypersphere, having each node of necklace spaced out as far as possible. This is like a maximum entropy arrangement, leading to most information.
Not always beneficial to sharpen tuning curves (information in population code): Zhang & Sejnowski, 1999.
Normalization and correlated noise: Abbott & Dayan, 1999; Averback, Latham & Pouget, 2006; Sompolinsky et al. 2001.
their geometrical approach as related to the probabilistic view of encoding: Beck, Ma, Latham & Pouget, 2007; Beck et al., 2008; Pouget, Dayan & Zemel, 2000, 2003; Schwartz & Simoncelli, 2001; Simoncelli & Olshausen, 2001; Zemel, Dayan, & Pouget, 1998.
Spiking neurons: Jazayeri & Movshon, 2006; Ma, Beck, Latham, & Pouget, 2006.
Subscribe to:
Posts (Atom)